GazePlotter
- In development since
- 2023
- Status
- Actively developed
- Source code
- Open source
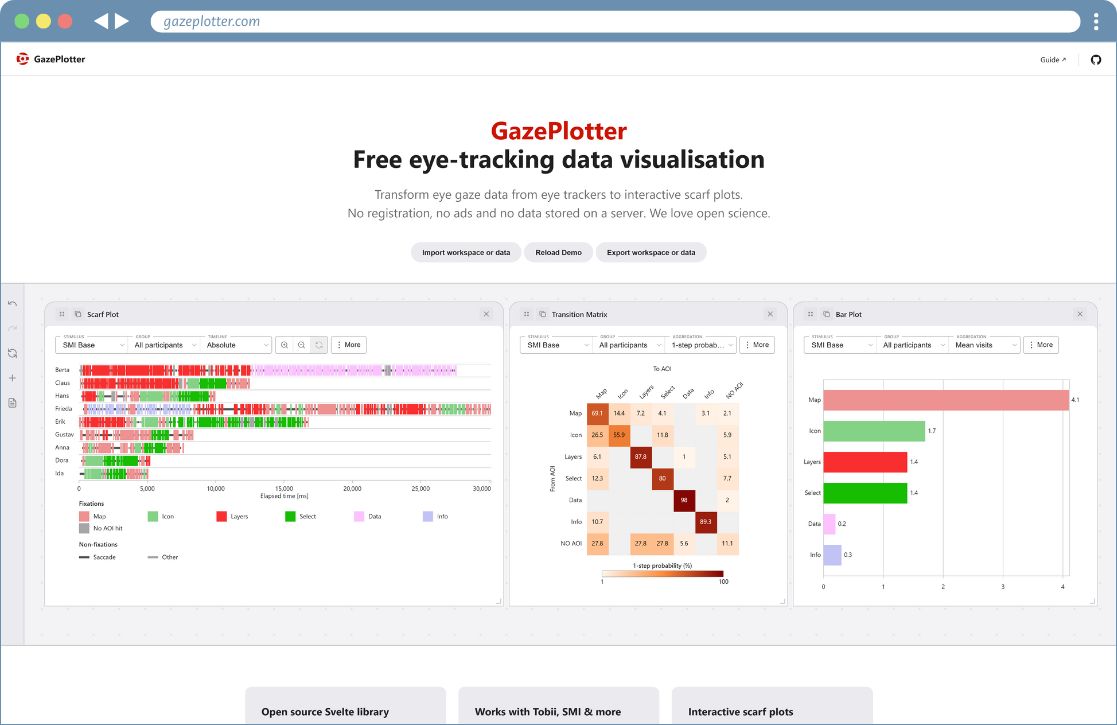
GazePlotter is a free, open-source web application for visualising and analysing eye-tracking data based on areas of interest (AOIs). I develop it so that anyone can explore their gaze data straight in the browser: no installation, registration or coding is needed, and the data never leave the computer, because everything is processed locally.
It reads raw exports from six eye-tracking platforms (Tobii Pro Lab, SMI BeGaze, Pupil Cloud, GazePoint Analysis, OGAMA and Varjo XR) and turns them into an interactive dashboard: scarf plots showing who looked where and when, AOI transition matrices, bar charts of common metrics such as dwell time or time to first fixation, and time-binned AOI occupancy charts for whole groups of participants. It also handles dynamic AOIs that move or appear and disappear over time.
Plots can be arranged by drag and drop and exported as images, and the computed metrics can be downloaded as CSV for further statistics. Step-by-step guides are in the documentation. GazePlotter is also available as an npm package for embedding in Svelte applications.
Related publications
- 2026 Publication Visualization Lenses for Time-Binned AOI Occupancy in Eye-Tracking Analysis Proceedings of the 2026 Symposium on Eye Tracking Research and Applications
- Publication , 2026 GazePlotter: An open-source solution for the automatic generation of scarf plots from eye-tracking data Behavior Research Methods